
produce a barplot of cell barcode demultiplex statistics
Arguments
- find_barcode_result
output from
find_barcode
Value
a list of ggplot objects:
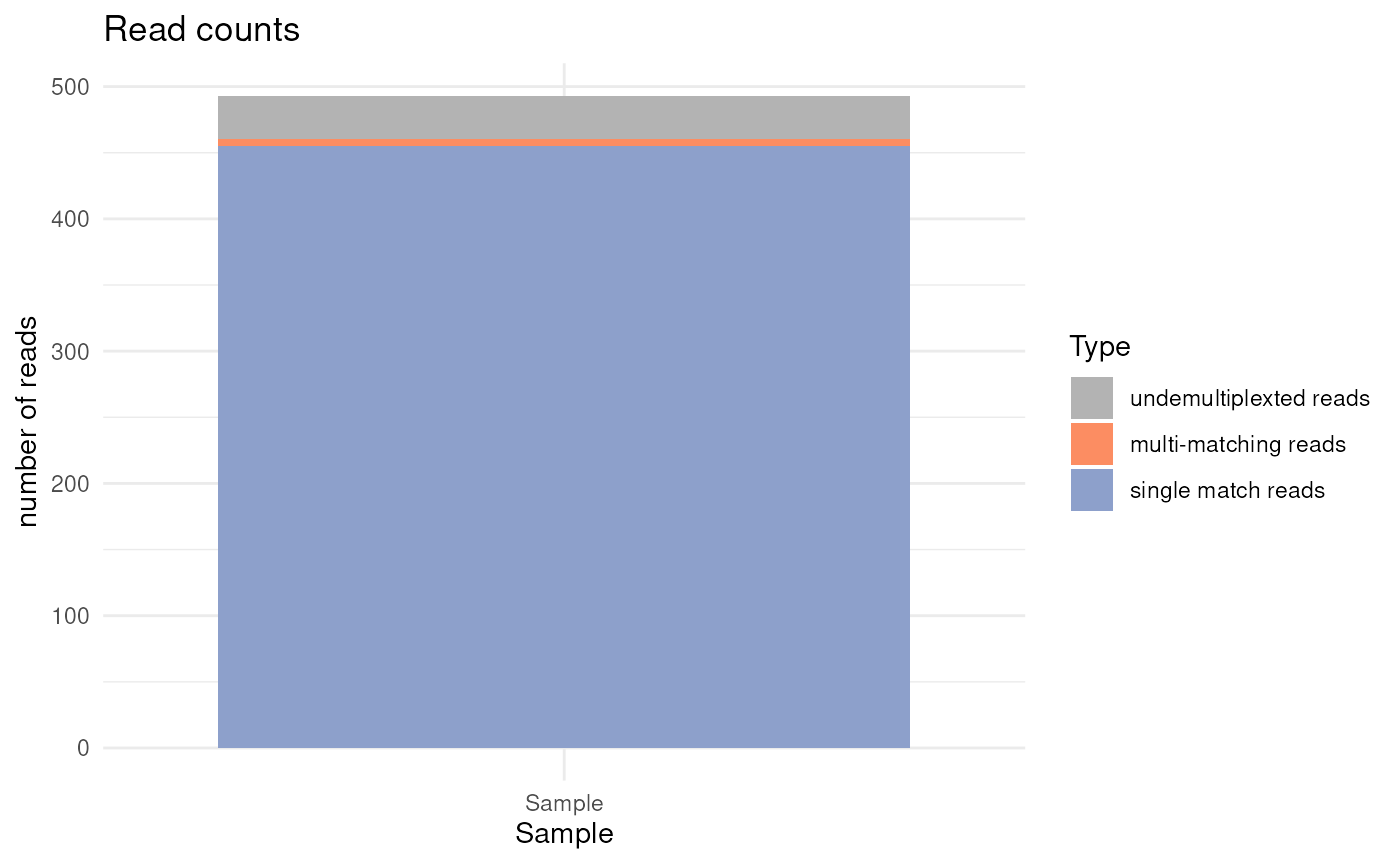
reads_count_plot: stacked barplot of: demultiplexed reads
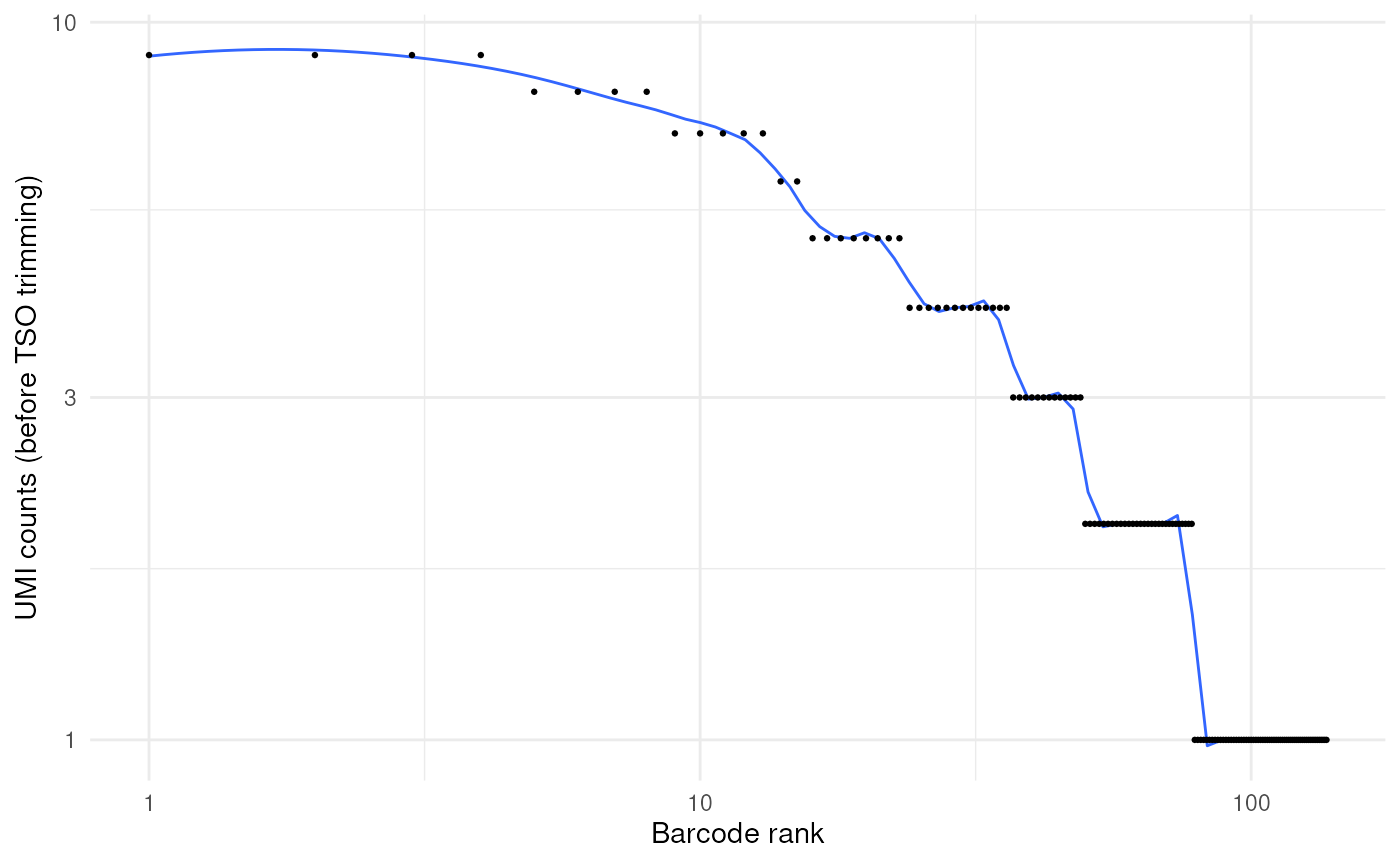
knee_plot: knee plot of UMI counts before TSO trimming
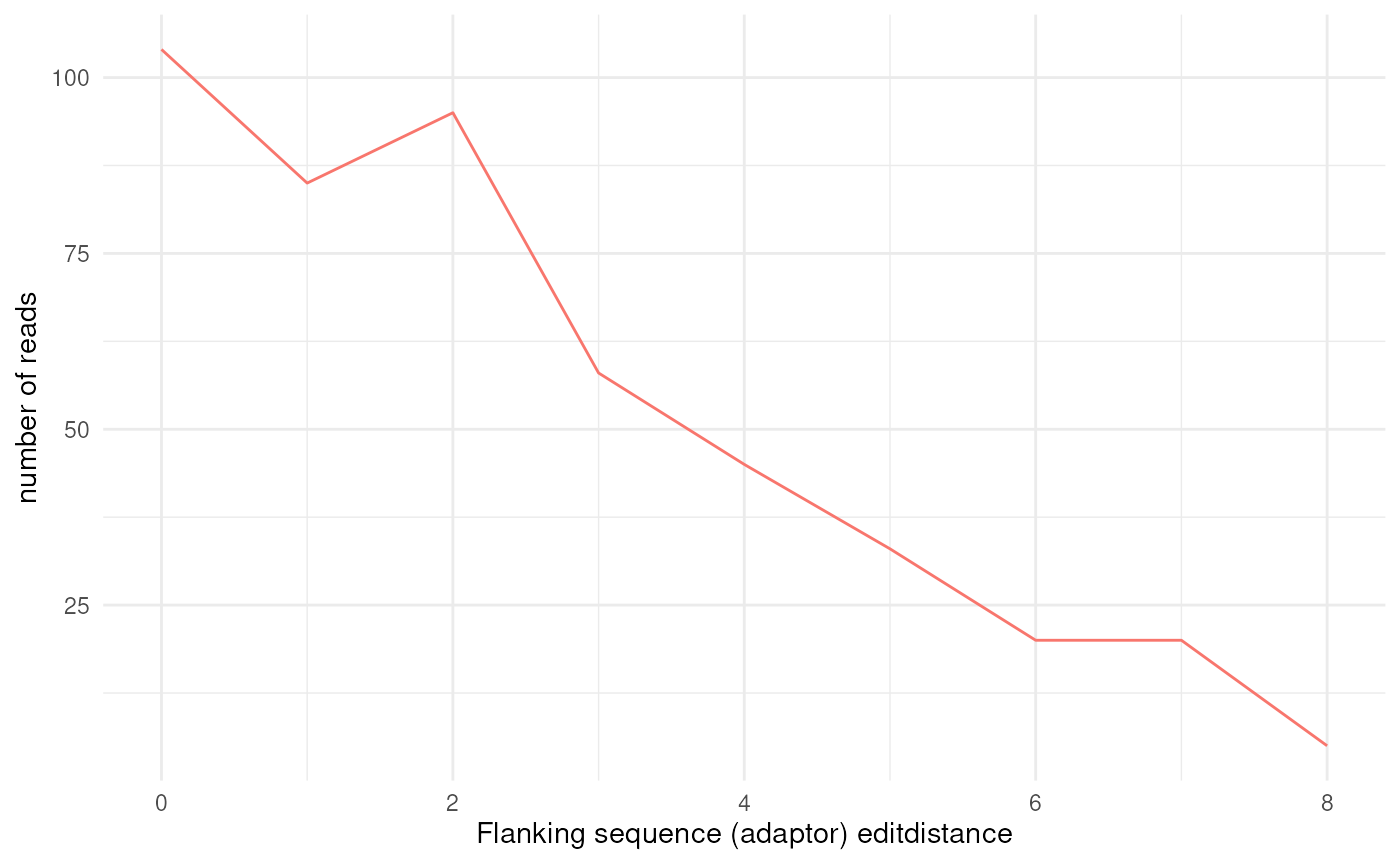
flank_editdistance_plot: flanking sequence (adaptor) edit-distance plot
barcode_editdistance_plot: barcode edit-distance plot
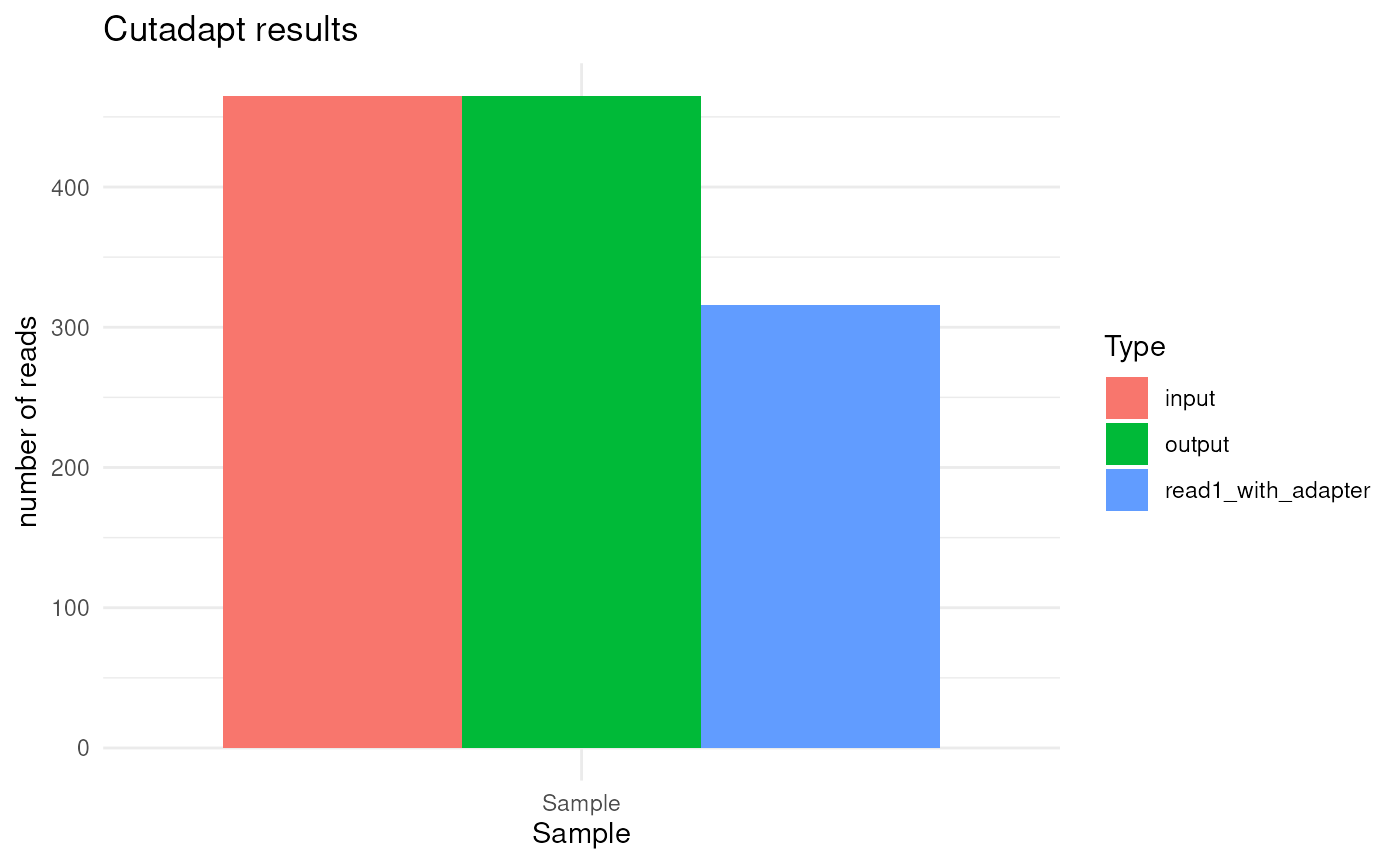
cutadapt_plot: if TSO trimming is performed, number of reads kept by cutadapt
Examples
outdir <- tempfile()
dir.create(outdir)
fastq_dir <- tempfile()
dir.create(fastq_dir)
file.copy(system.file("extdata", "fastq", "musc_rps24.fastq.gz", package = "FLAMES"),
file.path(fastq_dir, "musc_rps24.fastq.gz"))
#> [1] TRUE
sampled_lines <- readLines(file.path(fastq_dir, "musc_rps24.fastq.gz"), n = 400)
writeLines(sampled_lines, file.path(fastq_dir, "copy.fastq"))
bc_allow <- file.path(outdir, "bc_allow.tsv")
R.utils::gunzip(
filename = system.file("extdata", "bc_allow.tsv.gz", package = "FLAMES"),
destname = bc_allow, remove = FALSE
)
find_barcode(
fastq = fastq_dir,
stats_out = file.path(outdir, "bc_stat.tsv.gz"),
reads_out = file.path(outdir, "demultiplexed.fq"),
barcodes_files = bc_allow, TSO_seq = "CCCATGTACTCTGCGTTGATACCACTGCTT"
) |>
plot_demultiplex_raw()
#> Converting legacy `pattern` argument to `segments`...
#> Loading known barcodes from /tmp/RtmpgehRKJ/filebbc047d6c0af/bc_allow.tsv
#> Number of known barcodes: 143
#> FLEXIPLEX 1.02.6
#> Setting max flanking sequence edit distance to 8
#> Setting number of threads to 1
#> Search pattern:
#> primer: CTACACGACGCTCTTCCGATCT
#> CB: NNNNNNNNNNNNNNNN
#> UB: NNNNNNNNNNNN
#> polyT: TTTTTTTTT
#> CB:Z: tag field: CB
#> Processing file: /tmp/RtmpgehRKJ/filebbc046b60971/copy.fastq
#> Searching for barcodes...
#> Processing file: /tmp/RtmpgehRKJ/filebbc046b60971/musc_rps24.fastq.gz
#> Searching for barcodes...
#> Number of reads processed: 493
#> Number of reads where at least one barcode was found: 460
#> Number of chimera reads: 2
#> All done!
#> Reads Barcodes
#> 13 1
#> 12 3
#> 11 3
#> 10 3
#> 9 3
#> 8 2
#> 7 4
#> 6 4
#> 5 10
#> 4 14
#> 3 13
#> 2 36
#> 1 41
#> $reads_count_plot
 #>
#> $knee_plot
#> `geom_smooth()` using formula = 'y ~ x'
#>
#> $knee_plot
#> `geom_smooth()` using formula = 'y ~ x'
 #>
#> $flank_editdistance_plot
#>
#> $flank_editdistance_plot
 #>
#> $cutadapt_plot
#>
#> $cutadapt_plot
 #>
#>