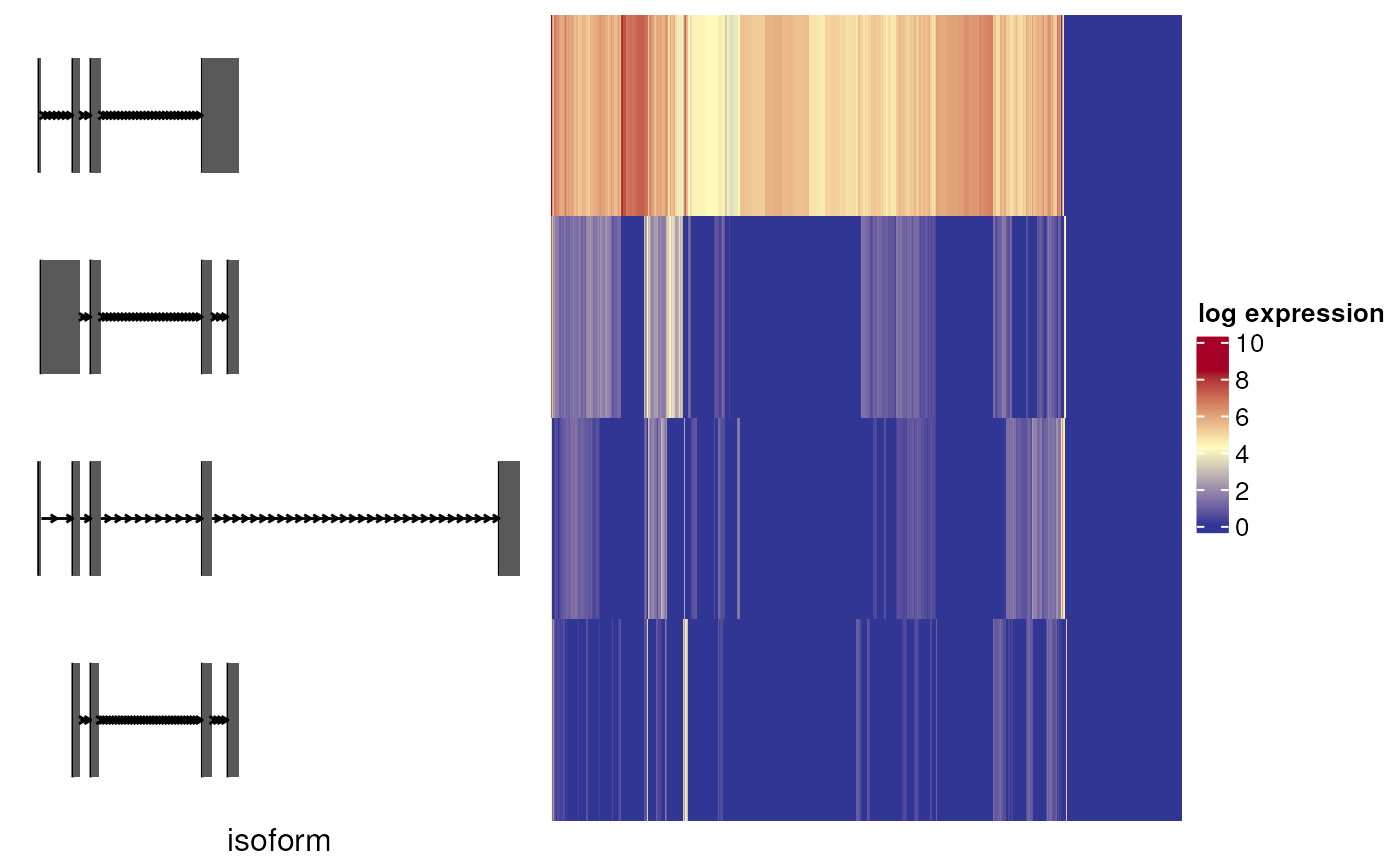
Plot expression heatmap of top n isoforms of a gene
Usage
plot_isoform_heatmap(
  sce,
  gene_id,
  transcript_ids,
  n = 4,
  isoform_legend_width = 7,
  col_low = "#313695",
  col_mid = "#FFFFBF",
  col_high = "#A50026",
  color_quantile = 1,
  cluster_palette,
  ...
)
Arguments
- sce
The
SingleCellExperimentobject containing transcript counts,rowRangesandrowDatawithgene_idandtranscript_idcolumns.- gene_id
The gene symbol of interest, ignored if
transcript_idsis provided.- transcript_ids
The transcript ids to plot.
- n
The number of top isoforms to plot from the gene. Ignored if
transcript_idsis provided.- isoform_legend_width
The width of isoform legends in heatmaps, in
cm.- col_low
Color for cells with low expression levels in UMAPs.
- col_mid
Color for cells with intermediate expression levels in UMAPs.
- col_high
Color for cells with high expression levels in UMAPs.
- color_quantile
The lower and upper expression quantile to be displayed bewteen
col_lowandcol_high, e.g. withcolor_quantile = 0.95, cells with expressions higher than 95% of other cells will all be shown incol_high, and cells with expression lower than 95% of other cells will all be shown incol_low.- cluster_palette
Optional, named vector of colors for the cluster annotations.
- ...
Additional arguments to pass to
Heatmap.
Details
Takes SingleCellExperiment object and plots an expression heatmap with the
isoform visualizations along genomic coordinates.
Examples
data(scmixology_lib10_transcripts)
scmixology_lib10_transcripts |>
  scrapper::normalizeRnaCounts.se() |>
  plot_isoform_heatmap(gene = "ENSG00000108107")
#> using unknown matrix fallback for 'data.frame'