Plot isoforms, either from a gene or a list of transcript ids.
Arguments
- sce
The
SingleCellExperimentobject containing transcript counts,rowRangesandrowDatawithgene_idandtranscript_idcolumns.- gene_id
The gene symbol of interest, ignored if
transcript_idsis provided.- transcript_ids
The transcript ids to plot.
- n
The number of top isoforms to plot from the gene. Ignored if
transcript_idsis provided.- format
The format of the output, either "plot_grid" or "list".
- colors
A character vector of colors to use for the isoforms. If not provided, gray will be used. for all isoforms.
Value
When format = "list", a list of ggplot objects is returned.
Otherwise, a grid of the plots is returned.
Details
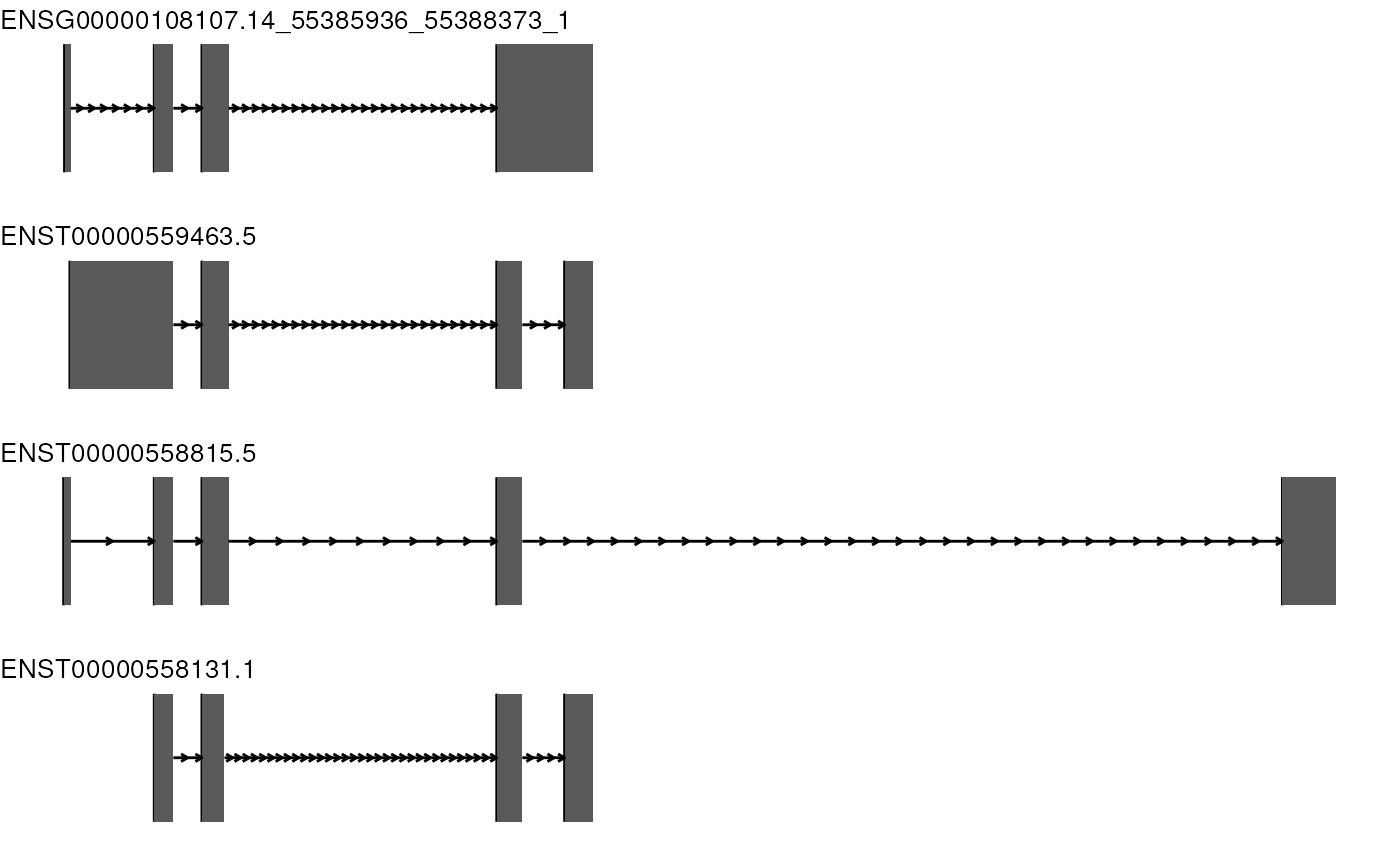
This function takes a SingleCellExperiment object and plots the top isoforms of a gene,
or a list of specified transcript ids. Either as a list of plots or together in a grid.
This function plots transcript isoforms as exon-intron structures and orders
the isoforms by expression levels (when specifying a gene) or by the order of the transcript_ids.
Examples
data(scmixology_lib10_transcripts)
plot_isoforms(scmixology_lib10_transcripts, gene_id = "ENSG00000108107")