Plot the average read coverages for each length bin or a perticular isoform
Arguments
- x,
path to the BAM file (aligning reads to the transcriptome), or the (GenomicAlignments::readGAlignments) parsed GAlignments object, or the tibble returned by
get_coverage, or the filtered tibble returned byfilter_coverage.- quantiles
numeric vector to specify the quantiles to bin the transcripts lengths by if length_bins is missing. The length bins will be determined such that the read counts are distributed acording to the quantiles.
- length_bins,
numeric vector to specify the sizes to bin the transcripts by
- weight_fn
function to calculate the weights for the transcripts. The function should take a numeric vector of read counts and return a numeric vector of weights. The default function is
weight_transcripts, you can change its default parameters by passing an anonymous function likefunction(x) weight_transcripts(x, type = 'equal').- filter_fn
Optional filter function to filter the transcripts before plotting. See the
filter_fnparameter infilter_coveragefor more details. Providing a filter fucntion here is the same as providing it infilter_coverageand then passing the result to this function.- detailed
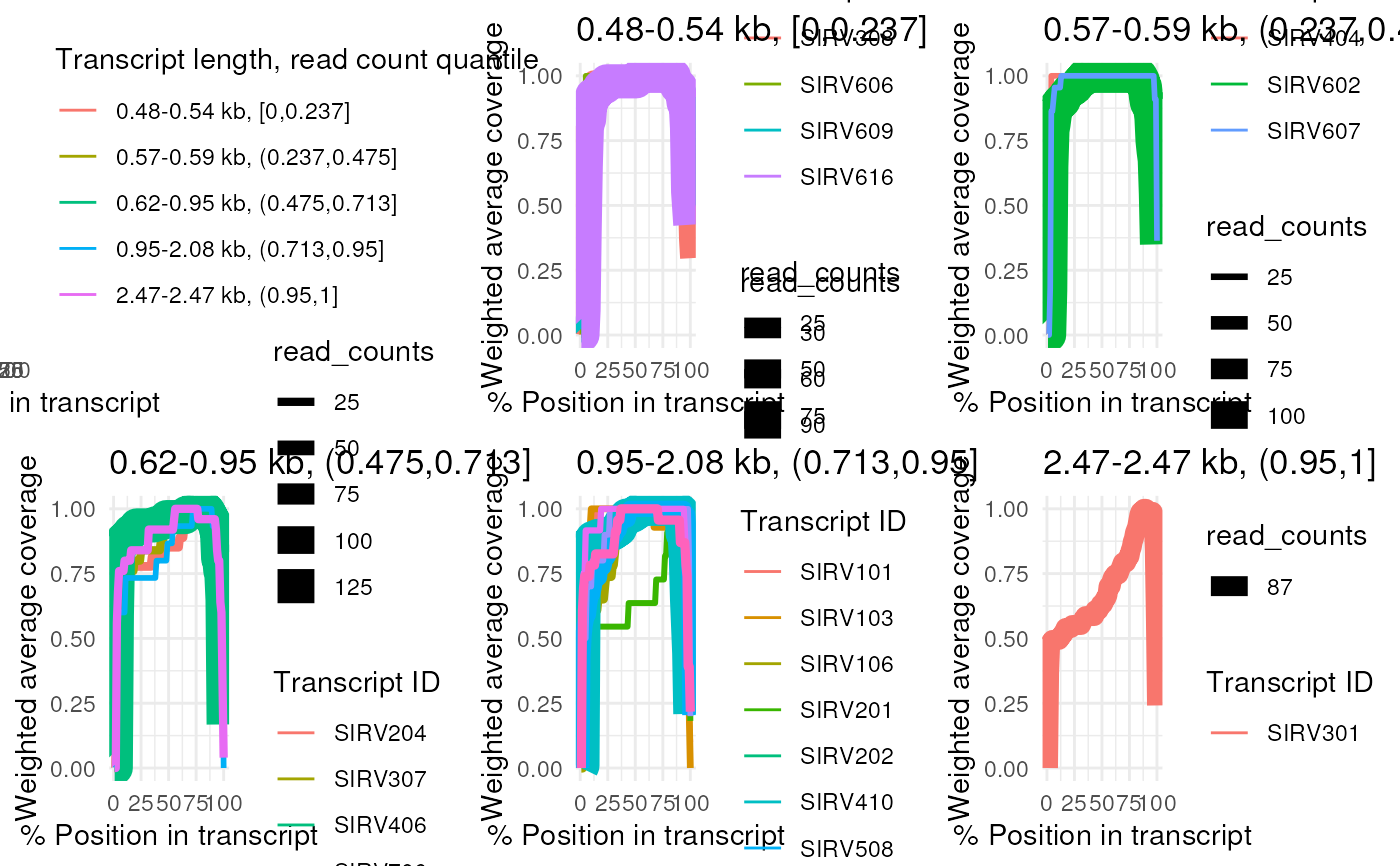
logical, if
TRUE, also plot the top 10 transcripts with the highest read counts for each length bin.
Examples
ppl <- example_pipeline("BulkPipeline")
#> ℹ Writing configuration to: /tmp/Rtmp4nGYdi/filebc442d3c1d8c/config_file_48196.json
#> Configured steps:
#> genome_alignment: TRUE
#> isoform_identification: TRUE
#> read_realignment: TRUE
#> transcript_quantification: TRUE
#> samtools not found, will use Rsamtools package instead
steps(ppl)["isoform_identification"] <- FALSE
ppl <- run_step(ppl, "read_realignment")
#> ── Running step: read_realignment @ Fri Jun 26 08:24:51 2026 ───────────────────
#> Using reference annotation for transcriptome assembly.
#> Realigning sample sample1 -> /tmp/Rtmp4nGYdi/filebc442d3c1d8c/sample1_realign2transcript.bam
#> Warning: samtools not found, using Rsamtools instead, this could be slower and might fail for large BAM files.
#> Skipped sorting BAM files.
#> Realigning sample sample2 -> /tmp/Rtmp4nGYdi/filebc442d3c1d8c/sample2_realign2transcript.bam
#> Warning: samtools not found, using Rsamtools instead, this could be slower and might fail for large BAM files.
#> Skipped sorting BAM files.
#> Realigning sample sample3 -> /tmp/Rtmp4nGYdi/filebc442d3c1d8c/sample3_realign2transcript.bam
#> Warning: samtools not found, using Rsamtools instead, this could be slower and might fail for large BAM files.
#> Skipped sorting BAM files.
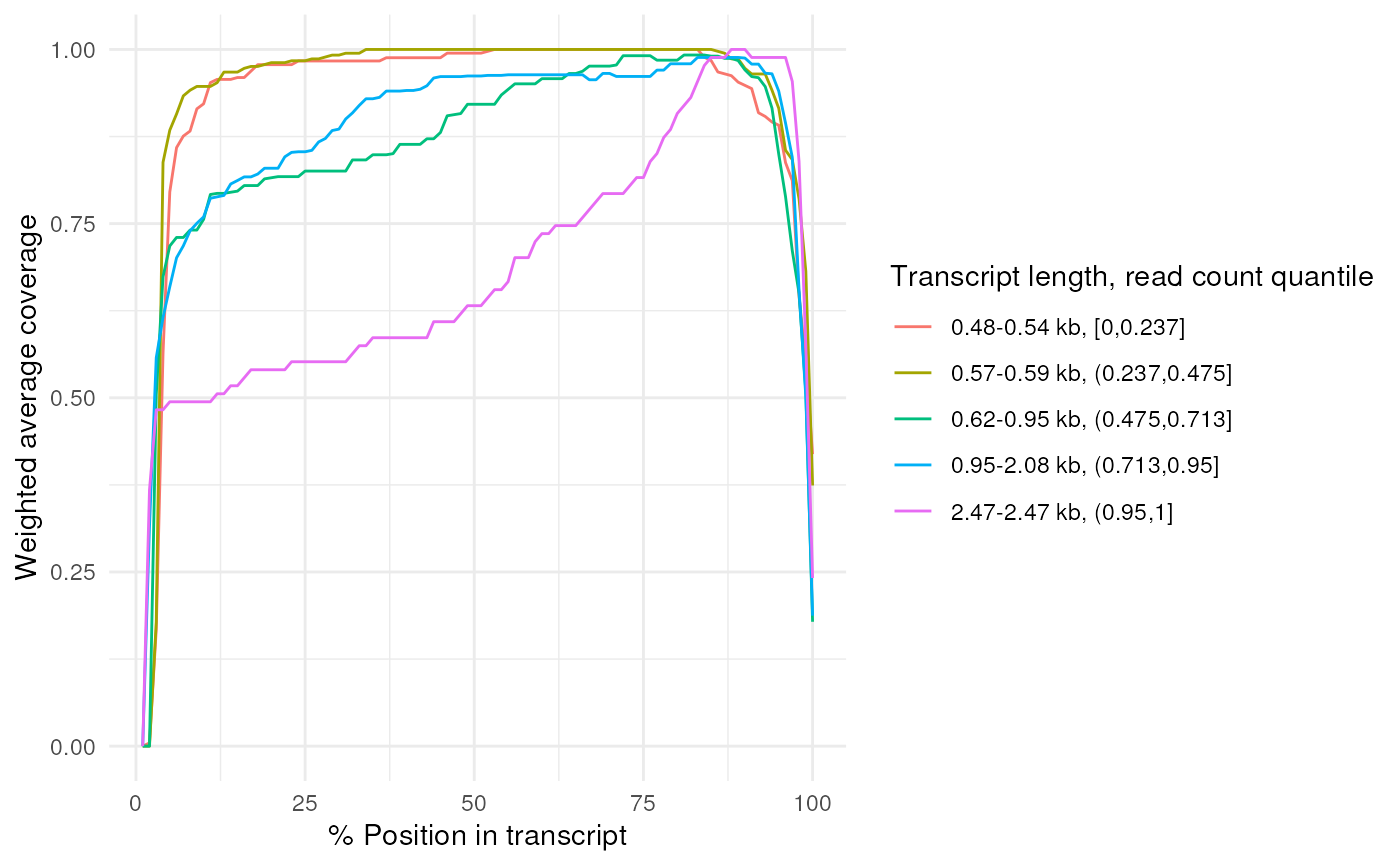
# Plot the coverages directly from the BAM file
plot_coverage(ppl@transcriptome_bam[[1]])
#> Using quantiles to bin transcripts.
#> The number of transcripts is less than the inflection index, returning equal weights for the current bin.
#> The number of transcripts is less than the inflection index, returning equal weights for the current bin.
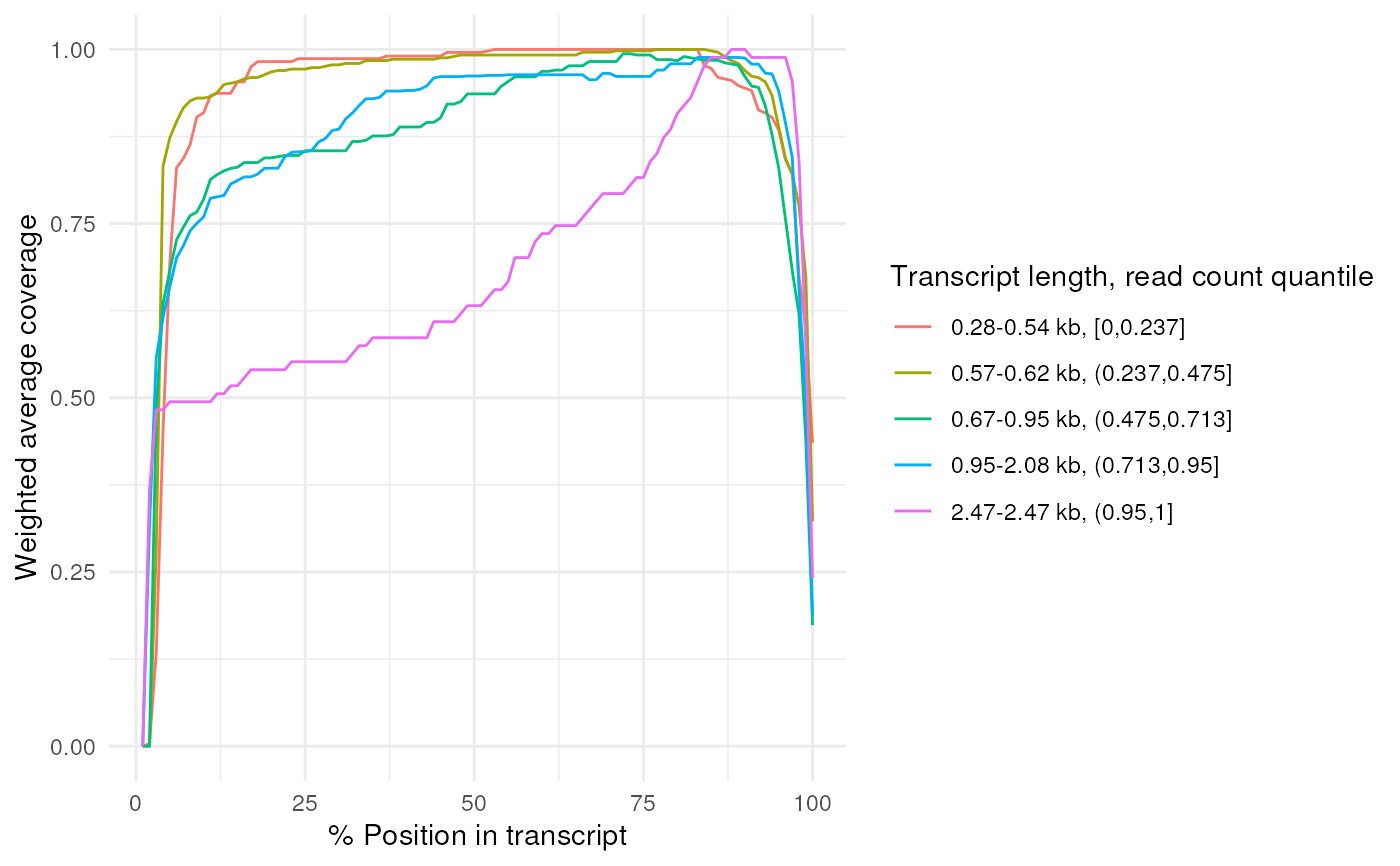 # Get the coverage information first
coverage <- get_coverage(ppl@transcriptome_bam[[1]]) |>
dplyr::filter(read_counts > 2) |> # Filter out transcripts with read counts < 3
filter_coverage(filter_fn = convolution_filter) # Filter out transcripts with sharp drops / rises
#> 2 transcripts found in the BAM file.
#> 0(0%) transcripts failed the filter.
#> Failed transcripts account for 0 reads, out of 217(0%) reads in total.
# Plot the filtered coverages
plot_coverage(coverage, detailed = TRUE)
#> Using quantiles to bin transcripts.
#> The number of transcripts is less than the inflection index, returning equal weights for the current bin.
#> The number of transcripts is less than the inflection index, returning equal weights for the current bin.
# Get the coverage information first
coverage <- get_coverage(ppl@transcriptome_bam[[1]]) |>
dplyr::filter(read_counts > 2) |> # Filter out transcripts with read counts < 3
filter_coverage(filter_fn = convolution_filter) # Filter out transcripts with sharp drops / rises
#> 2 transcripts found in the BAM file.
#> 0(0%) transcripts failed the filter.
#> Failed transcripts account for 0 reads, out of 217(0%) reads in total.
# Plot the filtered coverages
plot_coverage(coverage, detailed = TRUE)
#> Using quantiles to bin transcripts.
#> The number of transcripts is less than the inflection index, returning equal weights for the current bin.
#> The number of transcripts is less than the inflection index, returning equal weights for the current bin.
 # filtering function can also be passed directly to plot_coverage
plot_coverage(ppl@transcriptome_bam[[1]], filter_fn = convolution_filter)
#> 2 transcripts found in the BAM file.
#> 0(0%) transcripts failed the filter.
#> Failed transcripts account for 0 reads, out of 217(0%) reads in total.
#> Using quantiles to bin transcripts.
#> The number of transcripts is less than the inflection index, returning equal weights for the current bin.
#> The number of transcripts is less than the inflection index, returning equal weights for the current bin.
# filtering function can also be passed directly to plot_coverage
plot_coverage(ppl@transcriptome_bam[[1]], filter_fn = convolution_filter)
#> 2 transcripts found in the BAM file.
#> 0(0%) transcripts failed the filter.
#> Failed transcripts account for 0 reads, out of 217(0%) reads in total.
#> Using quantiles to bin transcripts.
#> The number of transcripts is less than the inflection index, returning equal weights for the current bin.
#> The number of transcripts is less than the inflection index, returning equal weights for the current bin.